Update on the Green Simulation Modeling Project & More
Welcome back.
So, welcome back. It has been some time since my last post. I’ve been quite busy with my job, other projects and this simulation. Also, I tried different approaches setting up the current simulation model, so this took quite some time. But now I have some updates. Before I go into detail (even with a video and some screenshots), I want to give you some more information about my plans with this blog and what you can expect from it.
Besides simulation modeling, I will focus also on sustainability, tech and AI. This is the combination I am interested in, where my expertise lies and what I think can bring a lot of value to the world. So, it could happen that the next post is not related to (green, sustainable) simulation modeling.
I can’t promise a certain amount of blog posts per month. I want to deliver real value and write about interesting concepts and thoughts. Yes, I could use GenAI to generate massive lines of text so I can post every week – or even every day.
However, in the “era” of GenAI, “real” and self-written texts with more depth are the blogs I am interested in – and which I want to be a part of.
I’d love to get in touch with you if you are interested in what I am writing about.
Update: Simulation Model for a (sustainable) car manufacturer
Quite some things happened.
I created a complete overview of a simplified car manufacturing process. See the picture below. I focused on certain manufacturing steps and for sure left some important steps out. But you know… you have to start somewhere. Currently, I separated the steps into: body shop, paint shop, general assembly and finishing process.


I setup the simulation model for the body shop with the following sub steps:

Video
First dependencies, logic, animations, data tracking and analysis exist already. I will show some details in the video. Below the video I describe the details.
Description
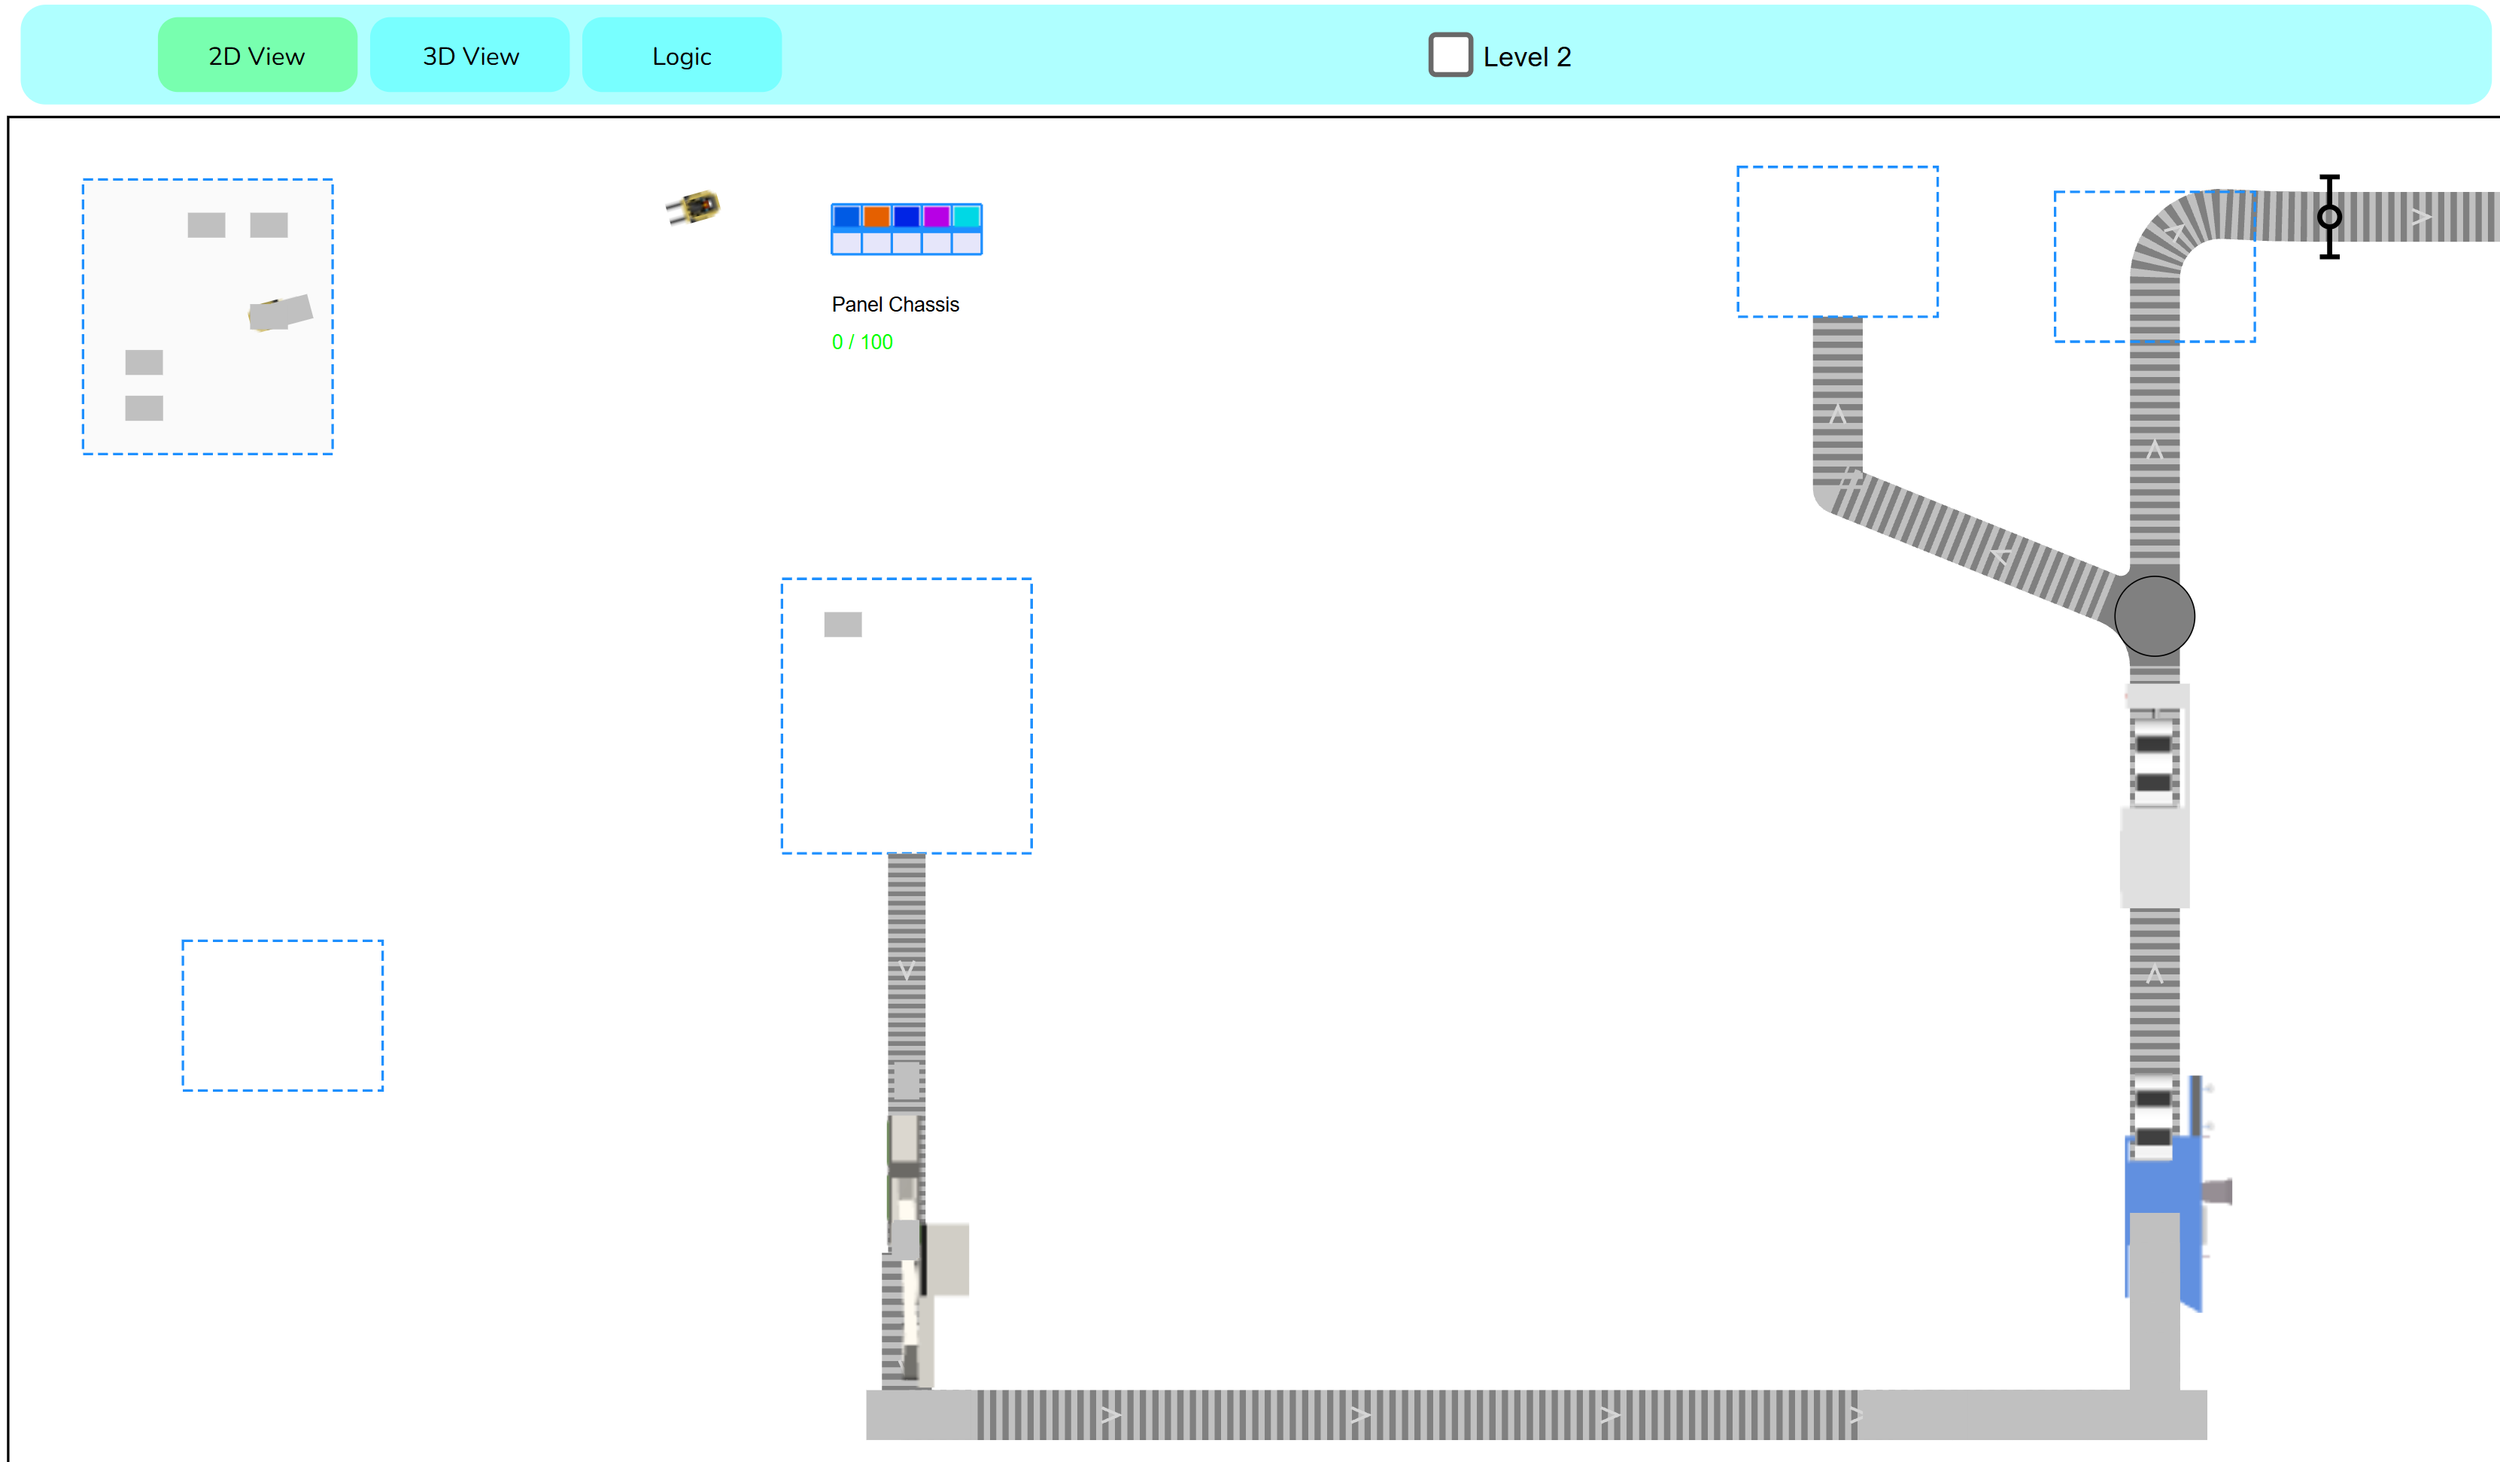
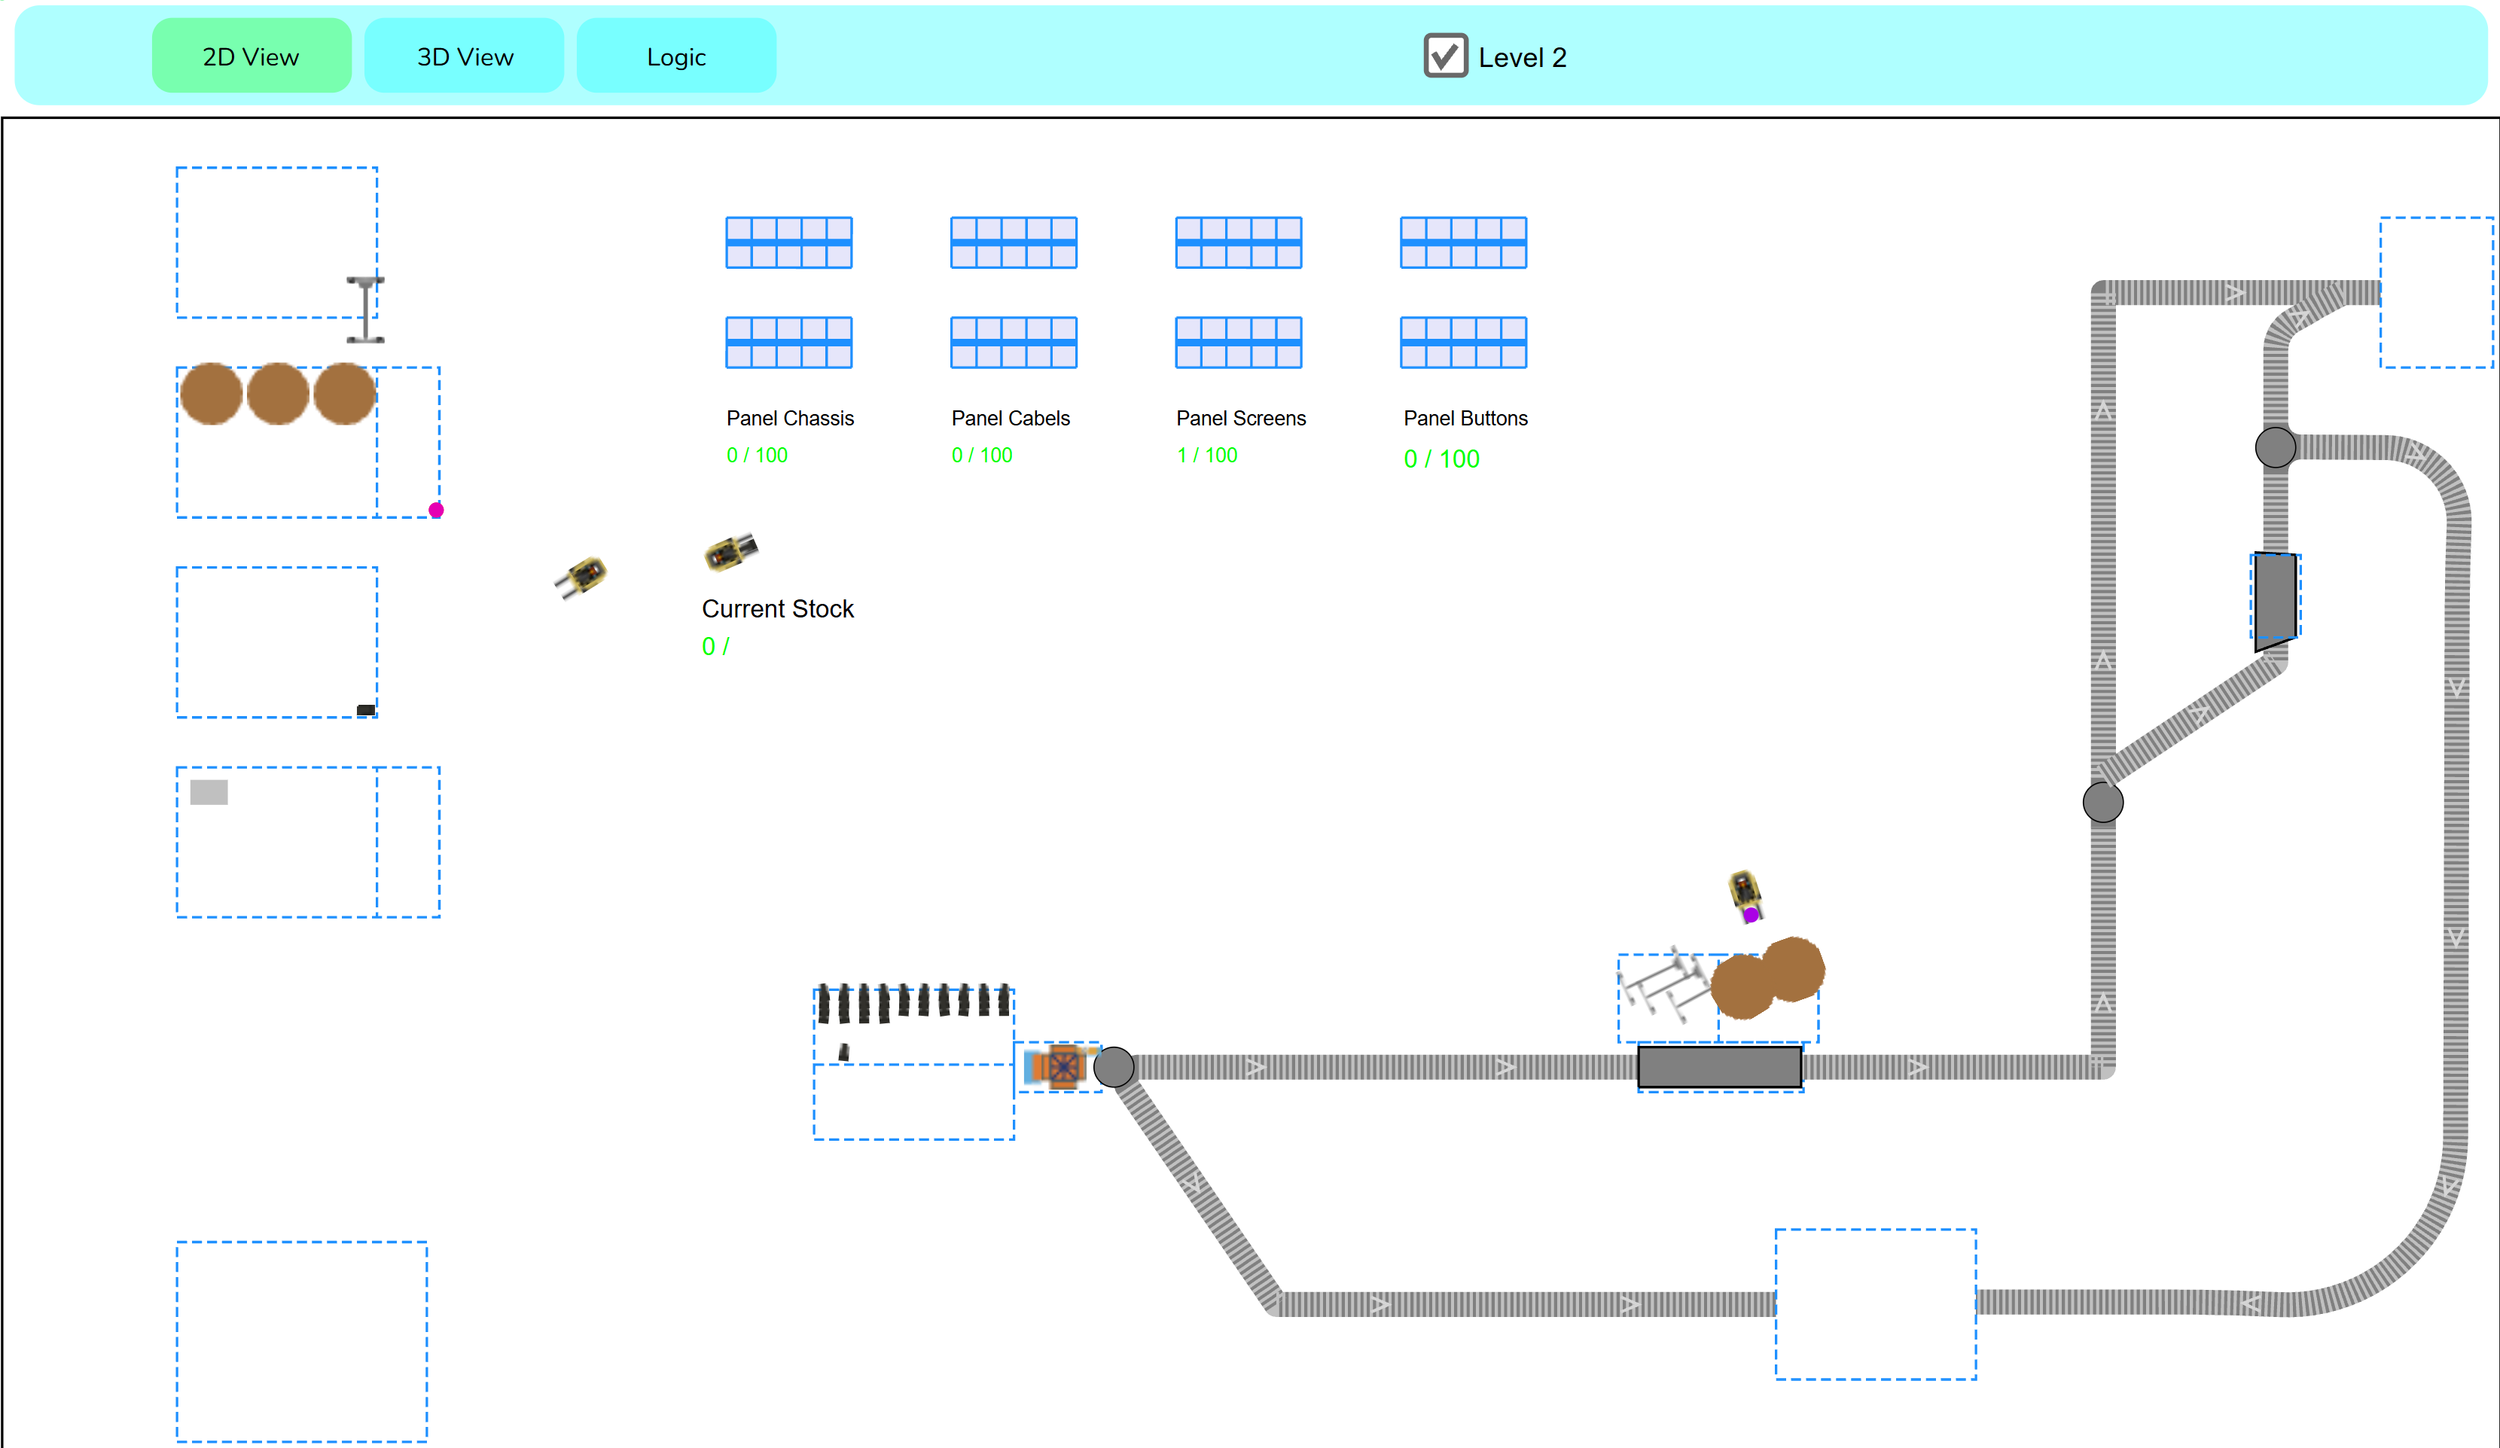
In this simulation model, I split the model in the areas “2D”, “3D” and “Logic”.
2D
In “2D” you can see the process. Since it is flat and straightforward, it gives you a quick and easy-to-understand overview of what is going on. It helps non-technical stakeholders of these kinds of simulations to better understand what is actually happening. Same counts for the 3D view.
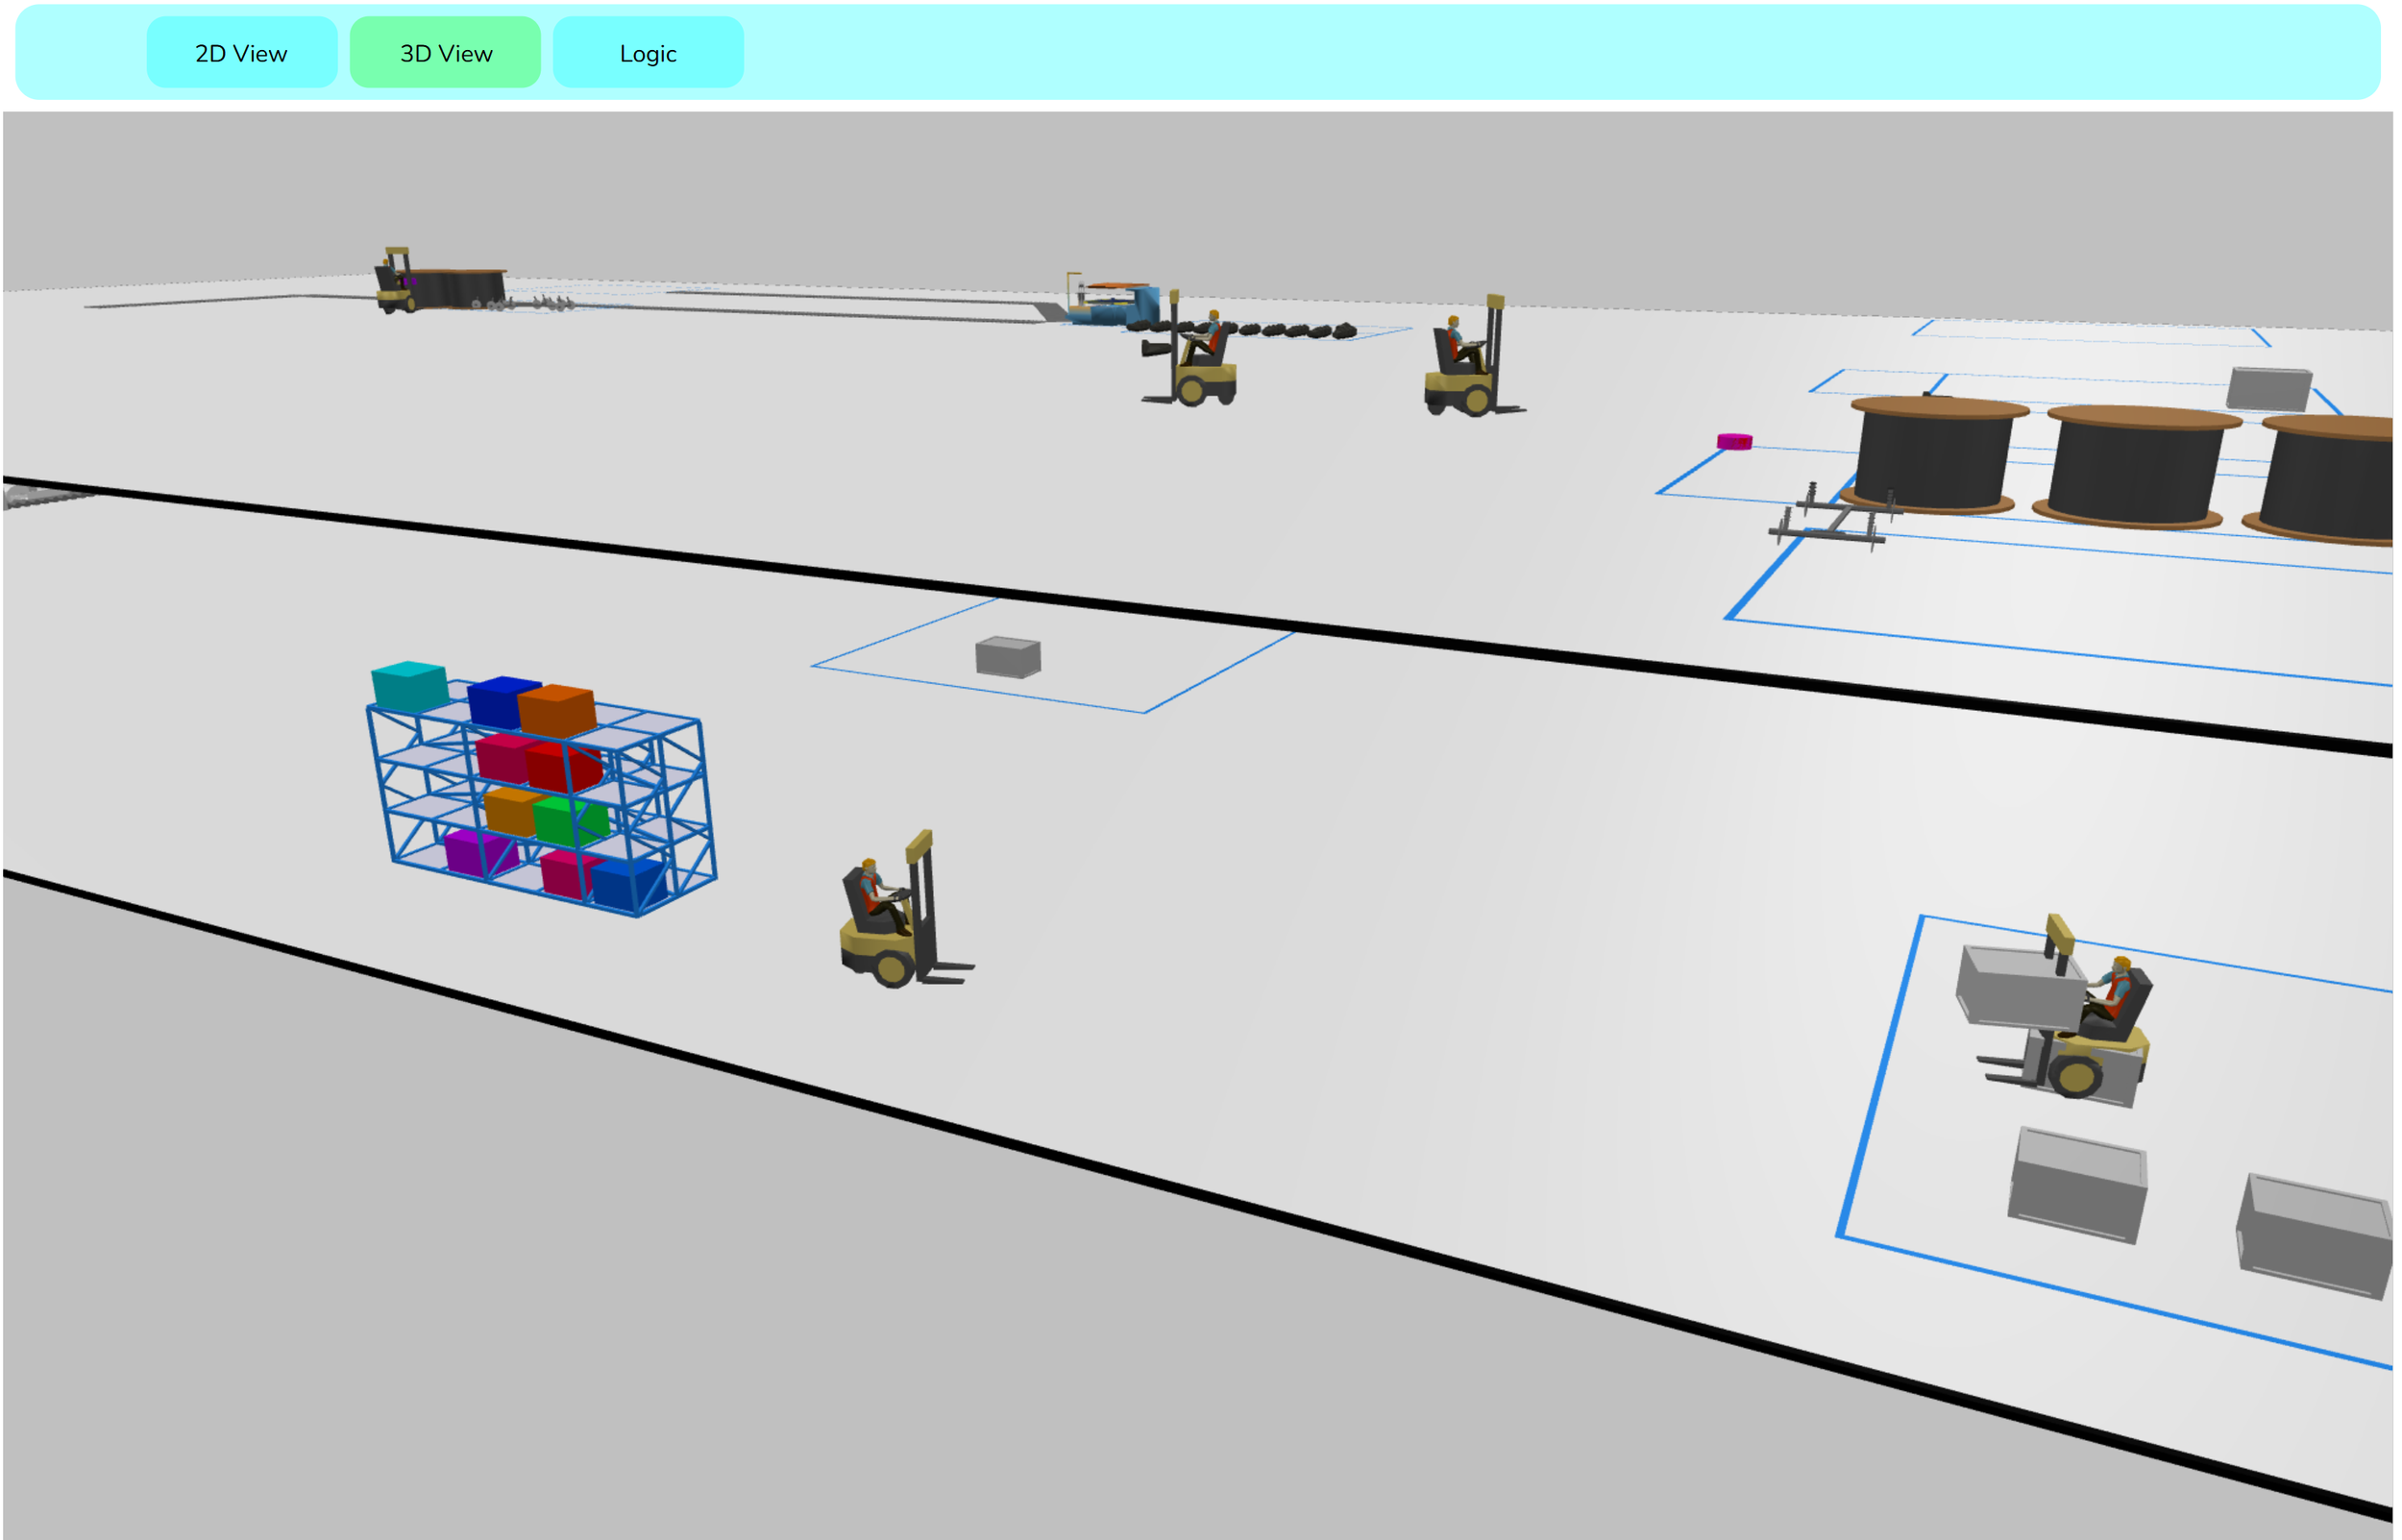
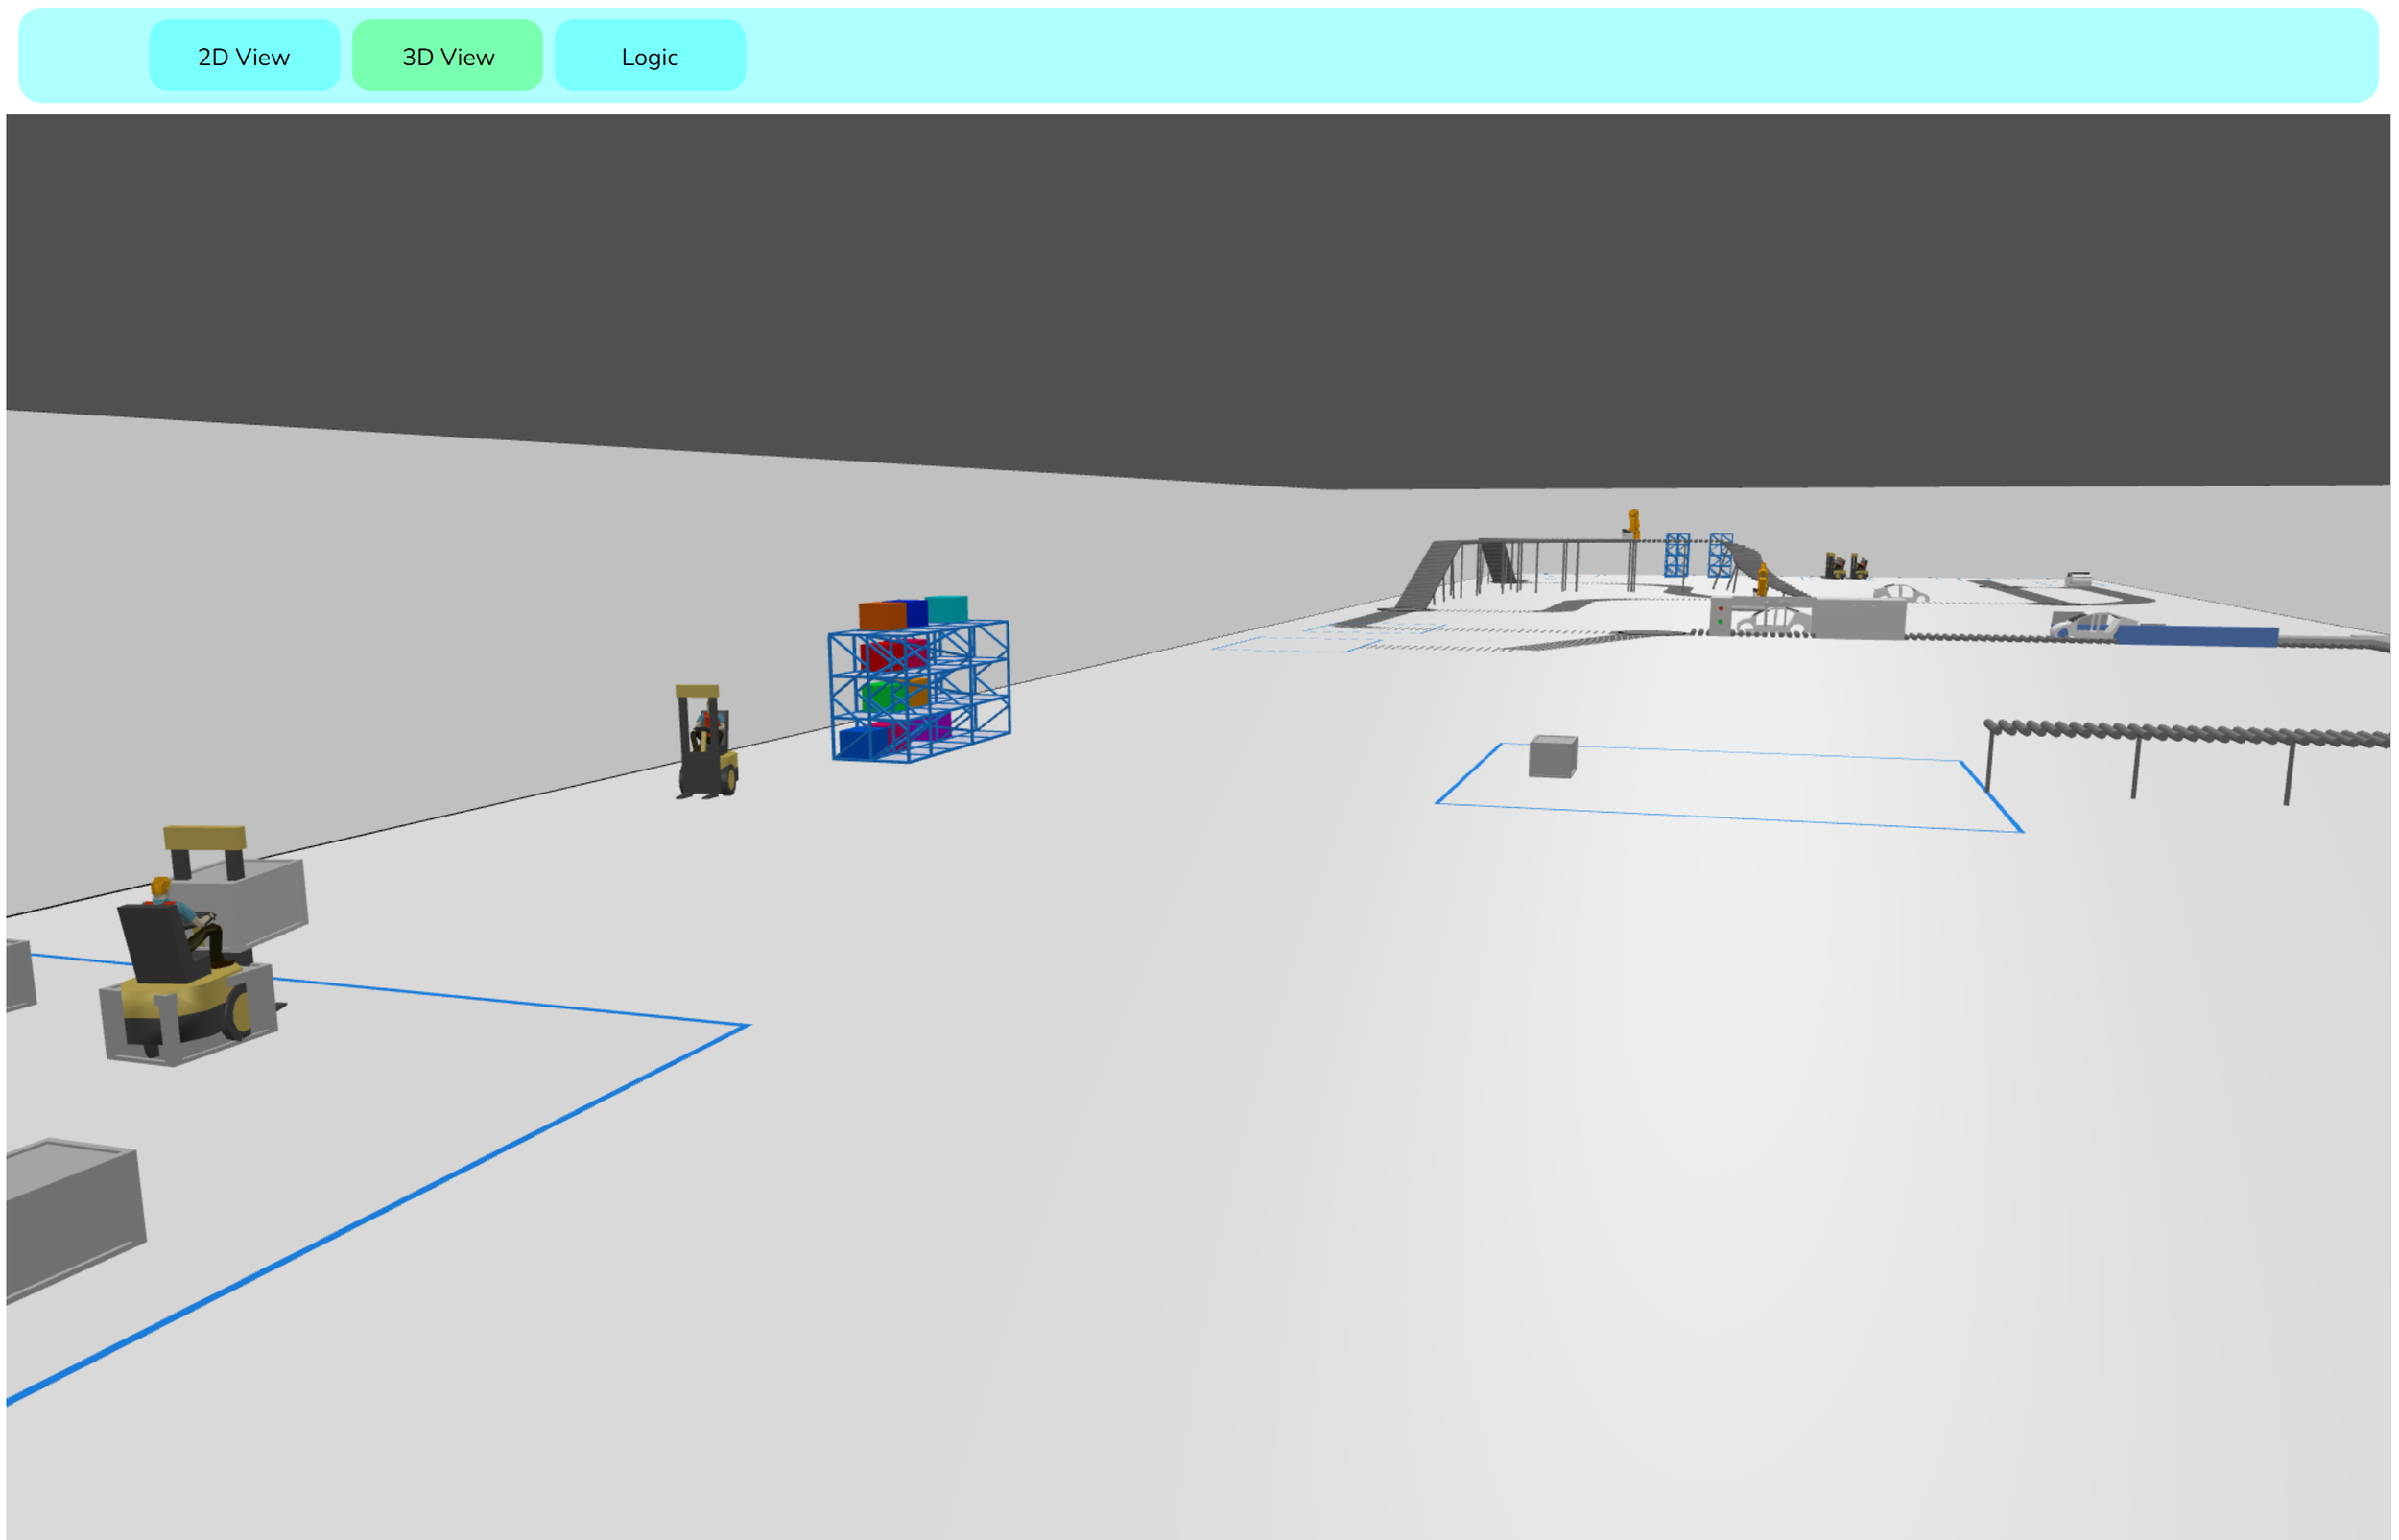
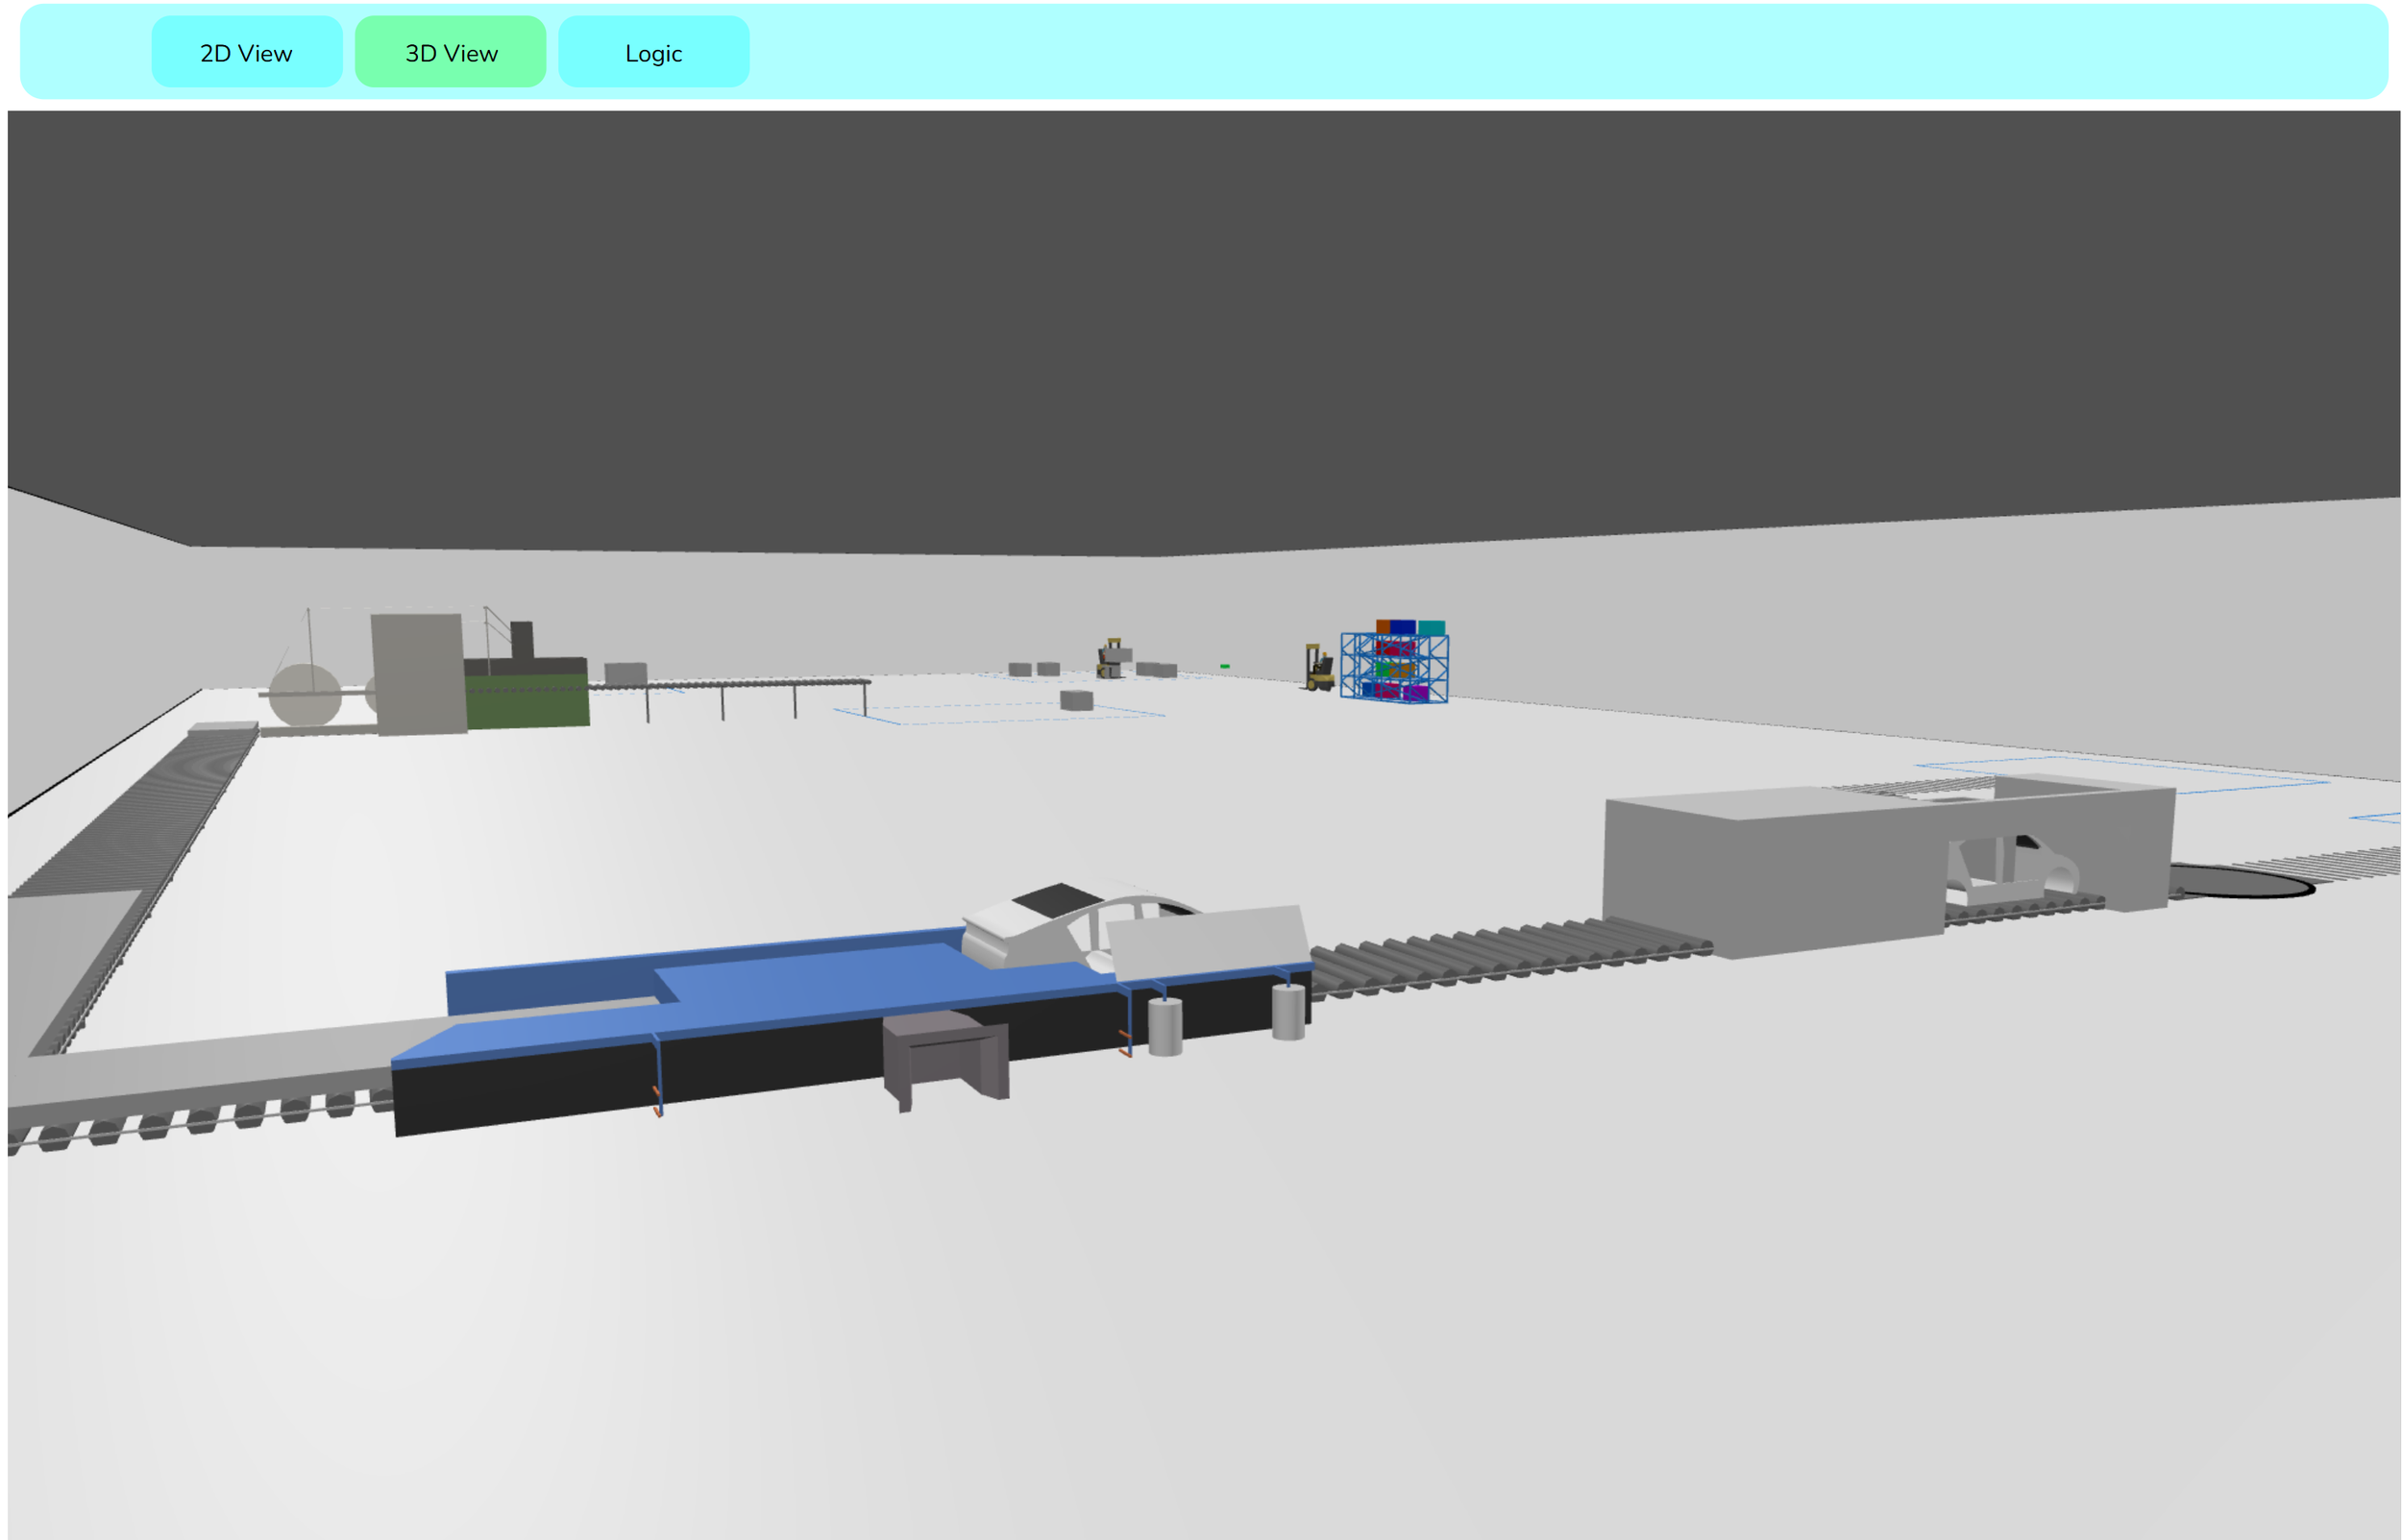
3D
In “3D” you can inspect the model during runtime to get a better understanding of the whole process. You can “fly” around, you can even have the feeling that you are in the facility itself.
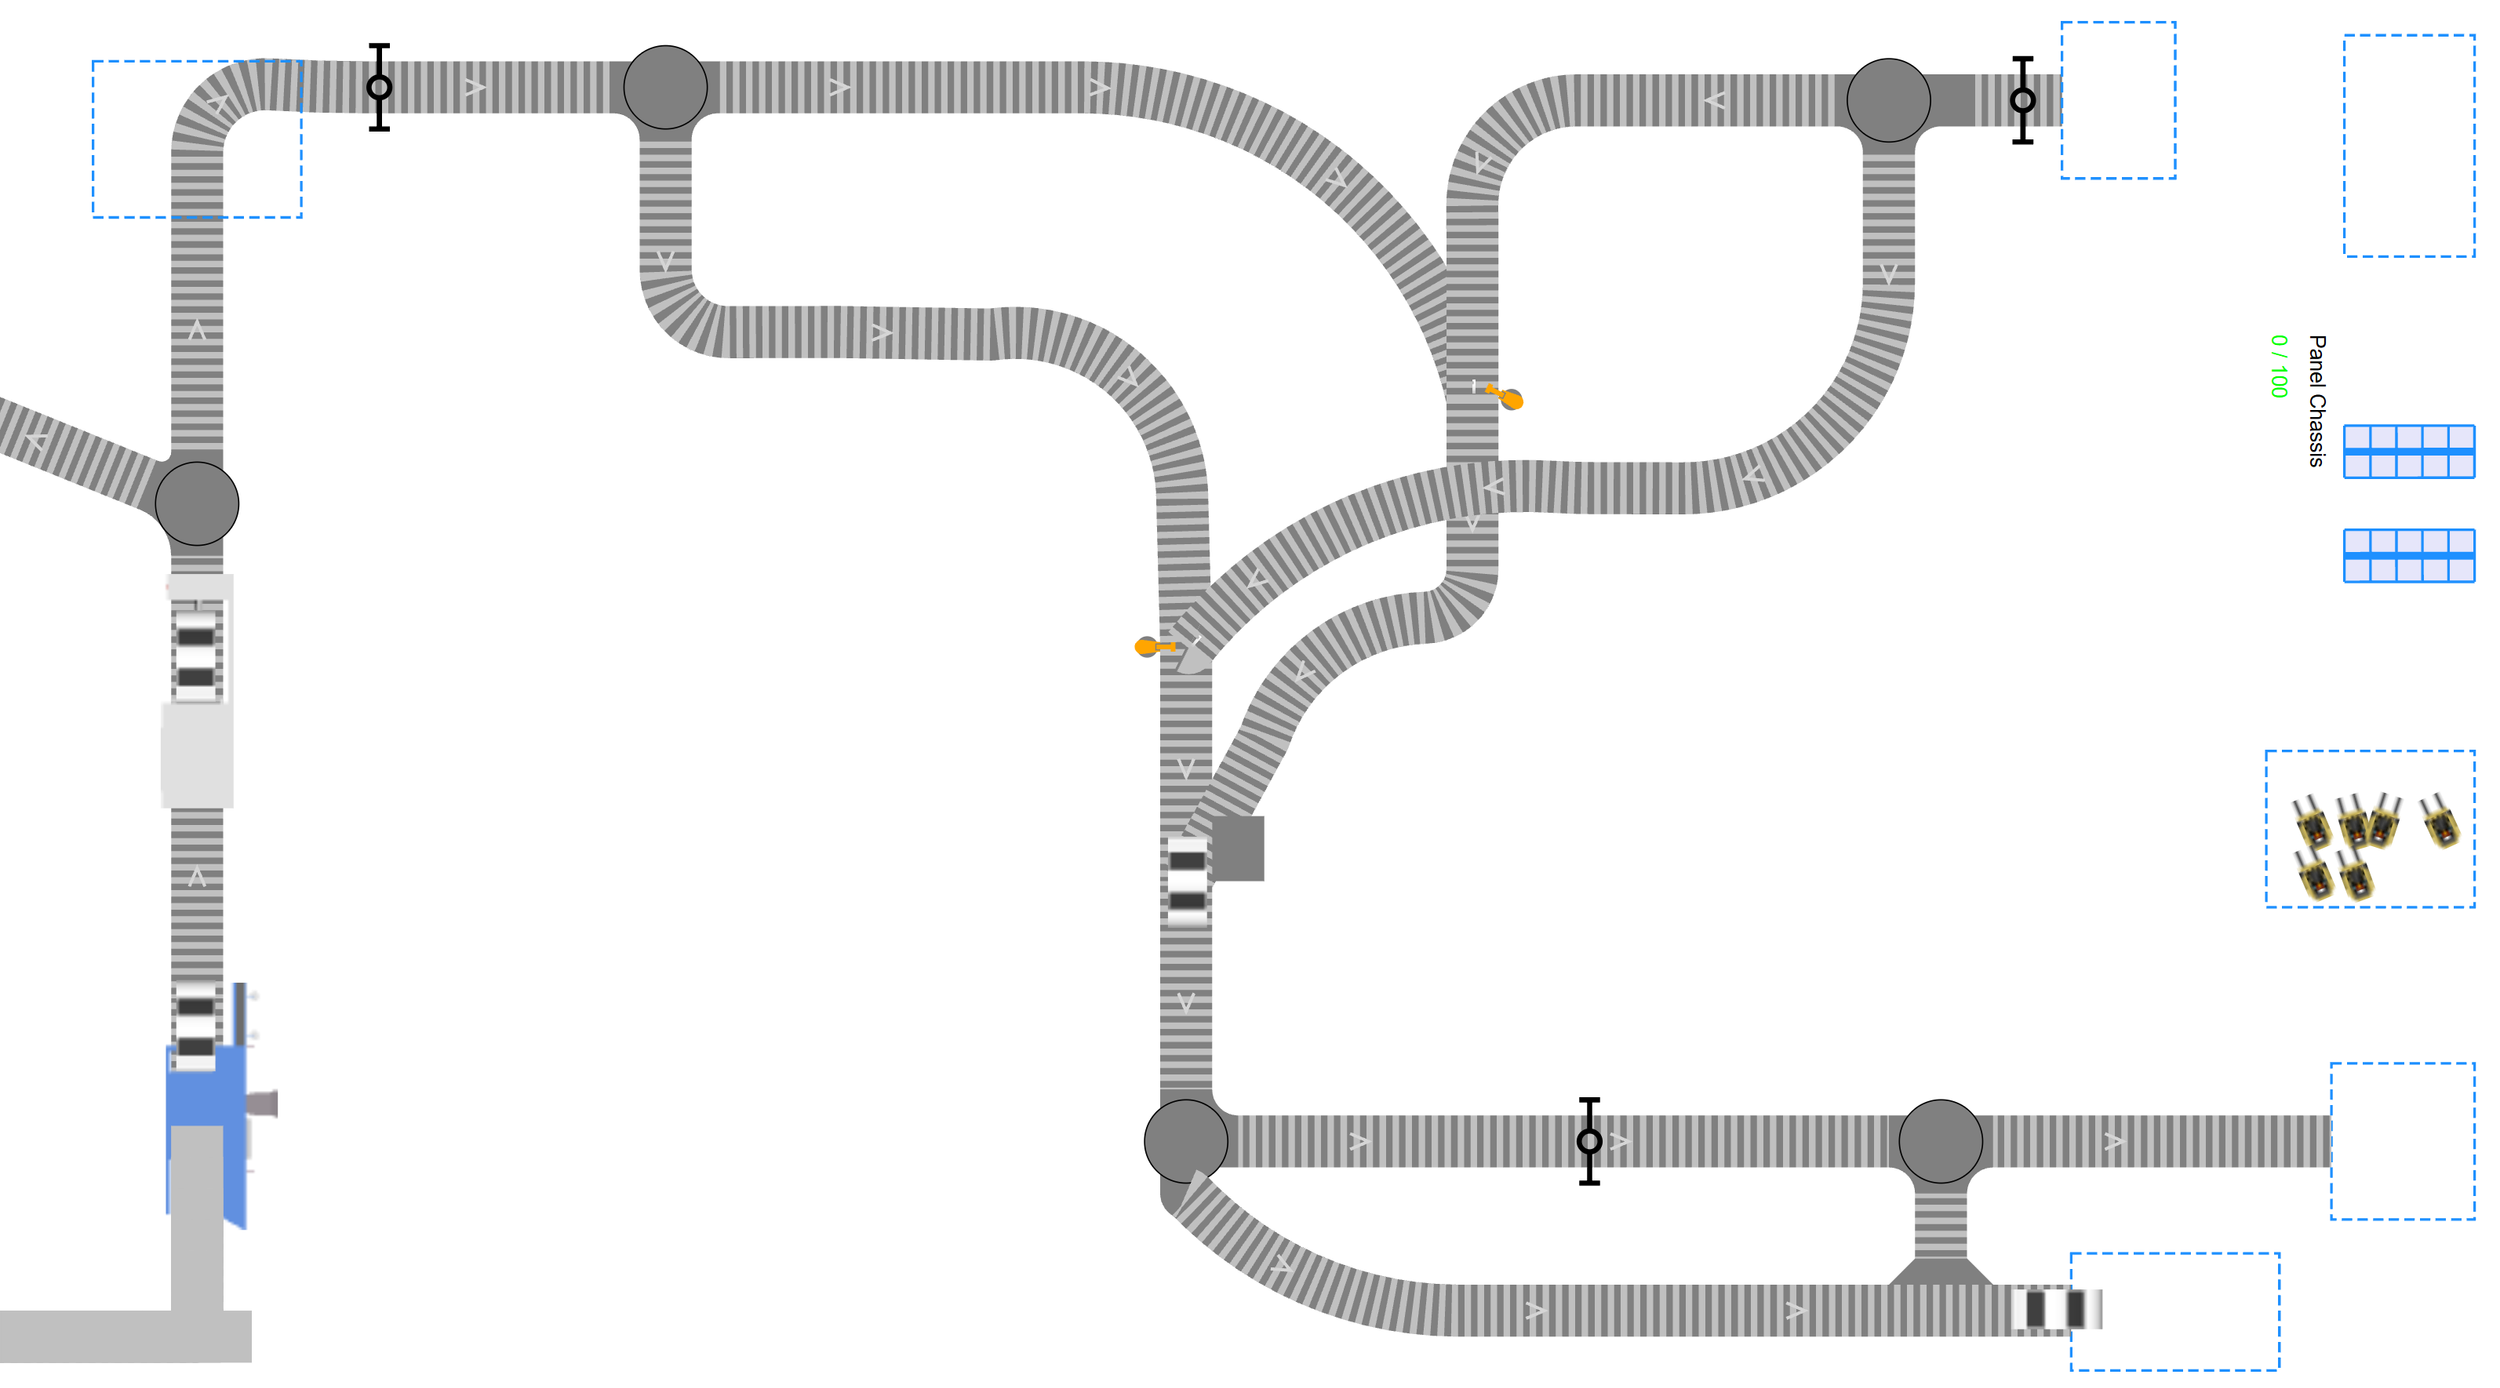
Logic
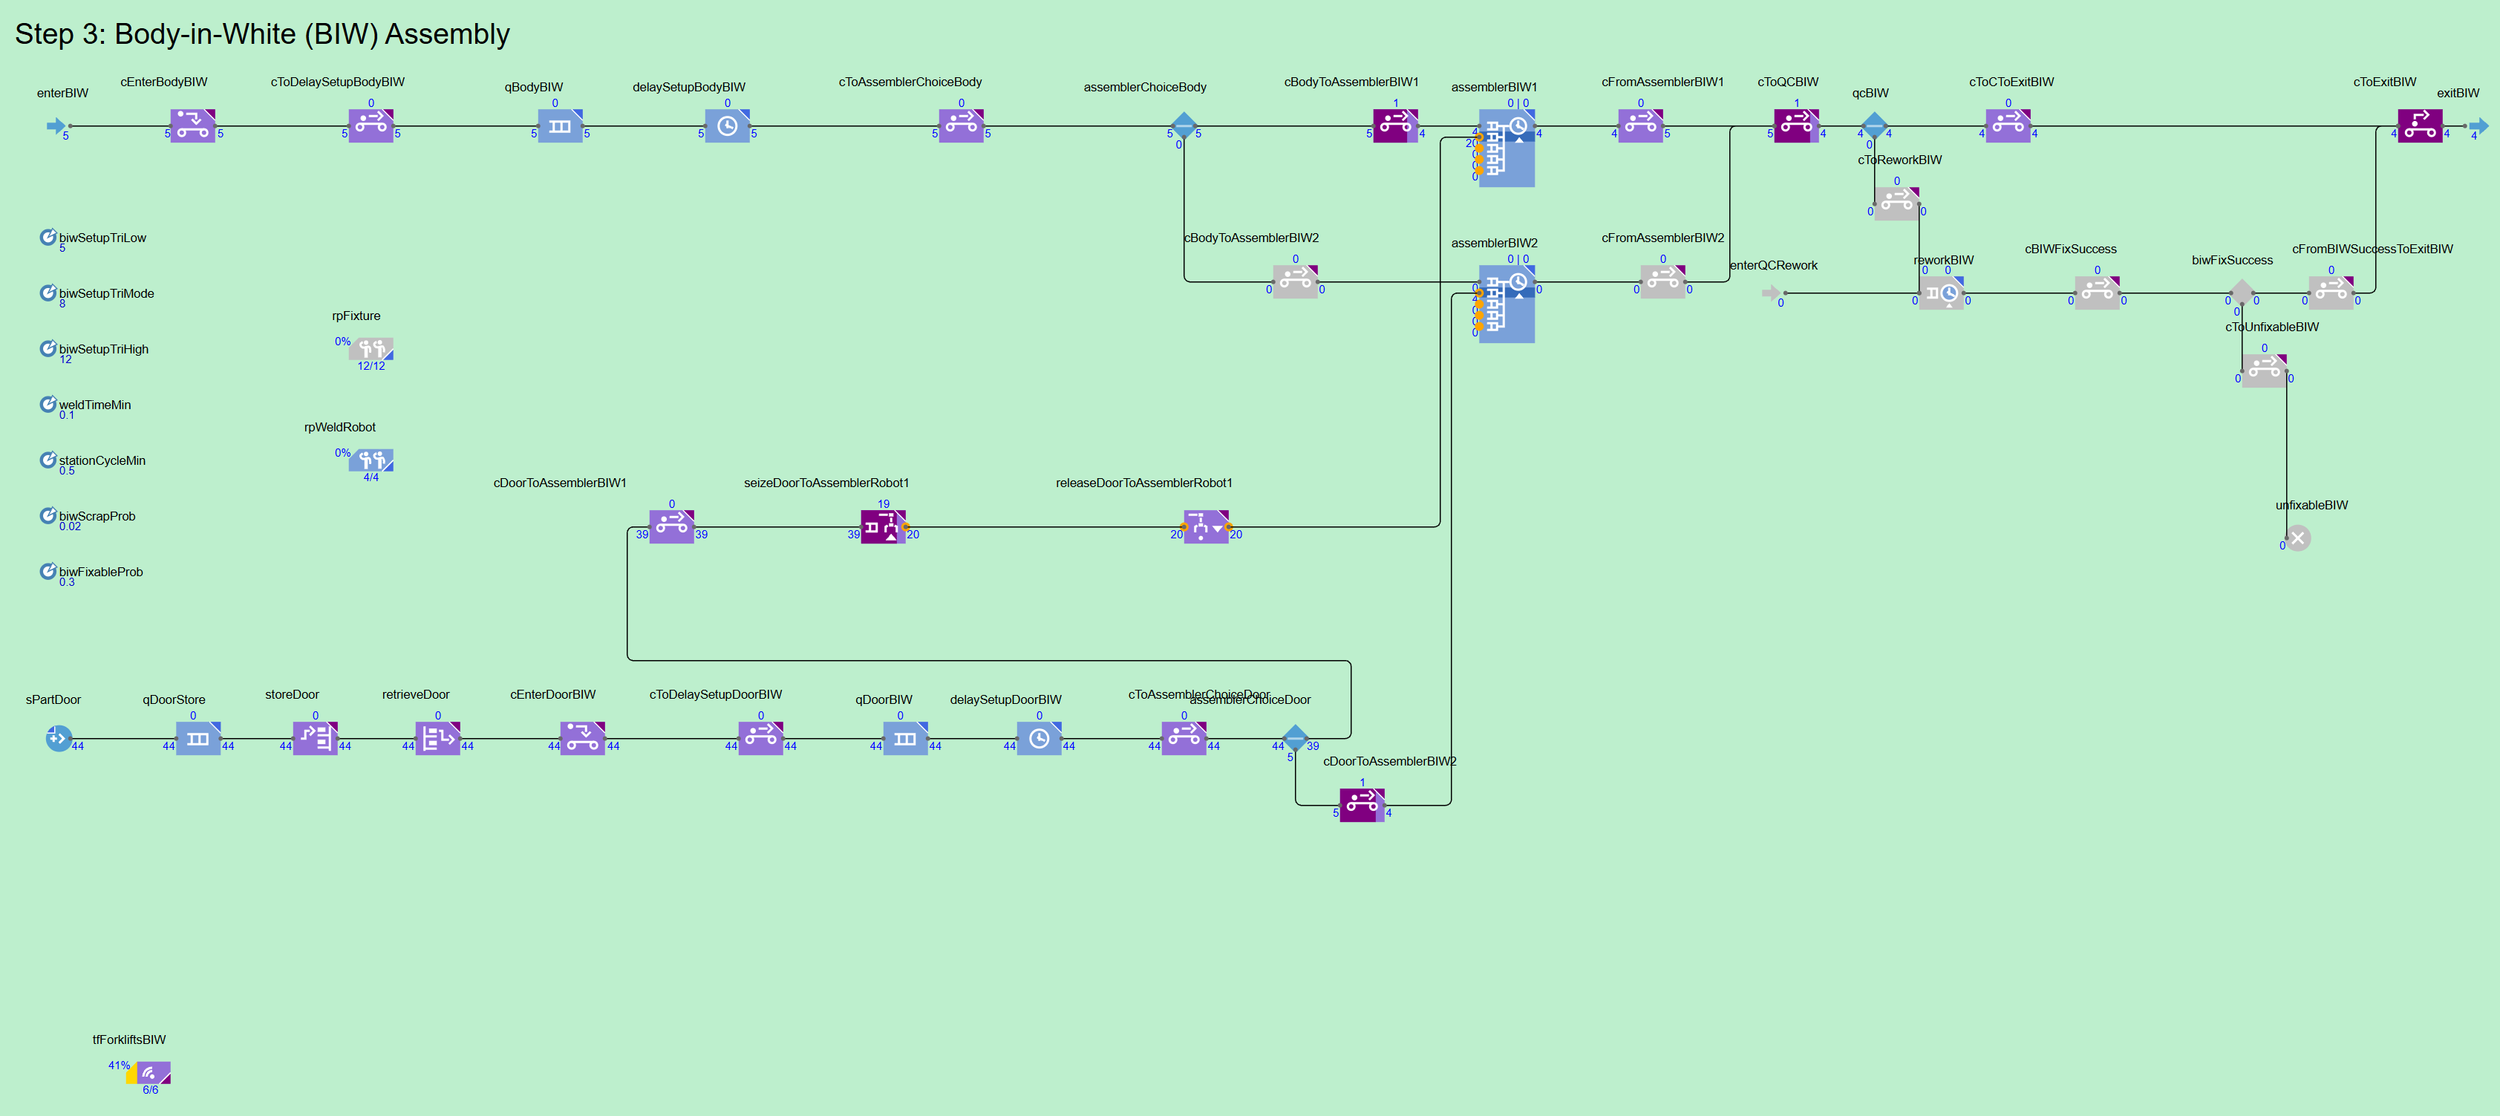
In “Logic” lies the dependencies, the logic itself (so the blocks, agents etc.) and the first data visualization. It gets more technical. You can see actual numbers, you can inspect single machines, you can quickly identify what is going right or wrong.
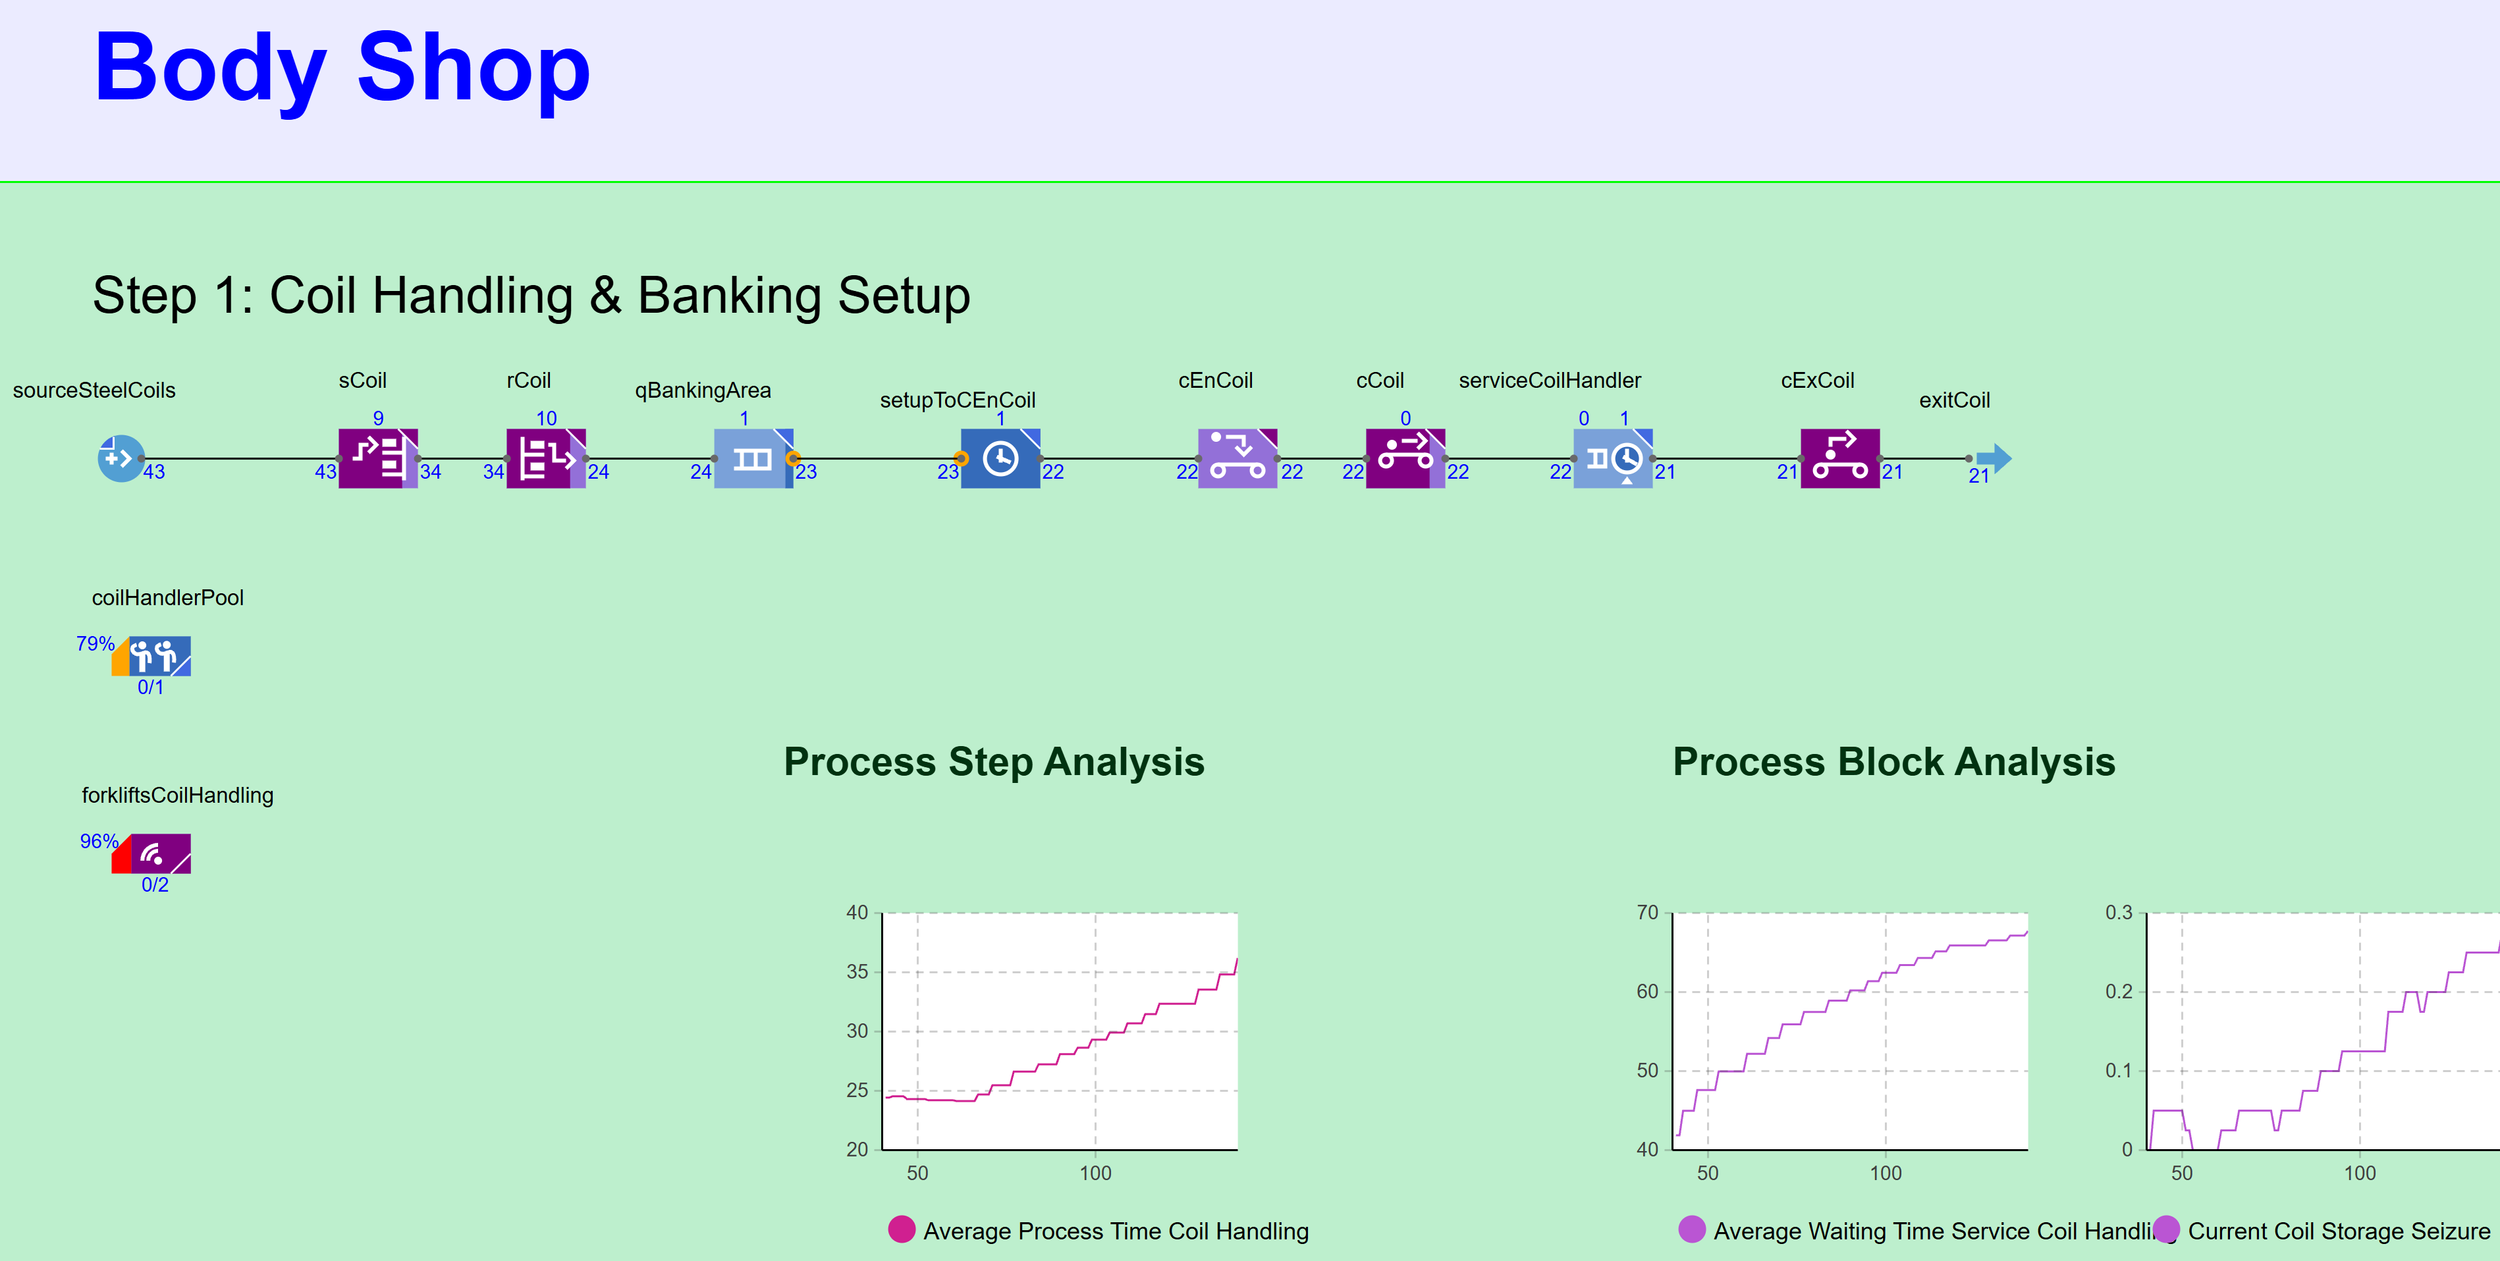
For this time, let’s inspect the “Step 1: Coil Handling & Banking Setup”. On Top, you can see the logic. The coil arrives, gets transported to and from the storage by the forklift fleet, is getting transported from one station to another and then exits this process step.
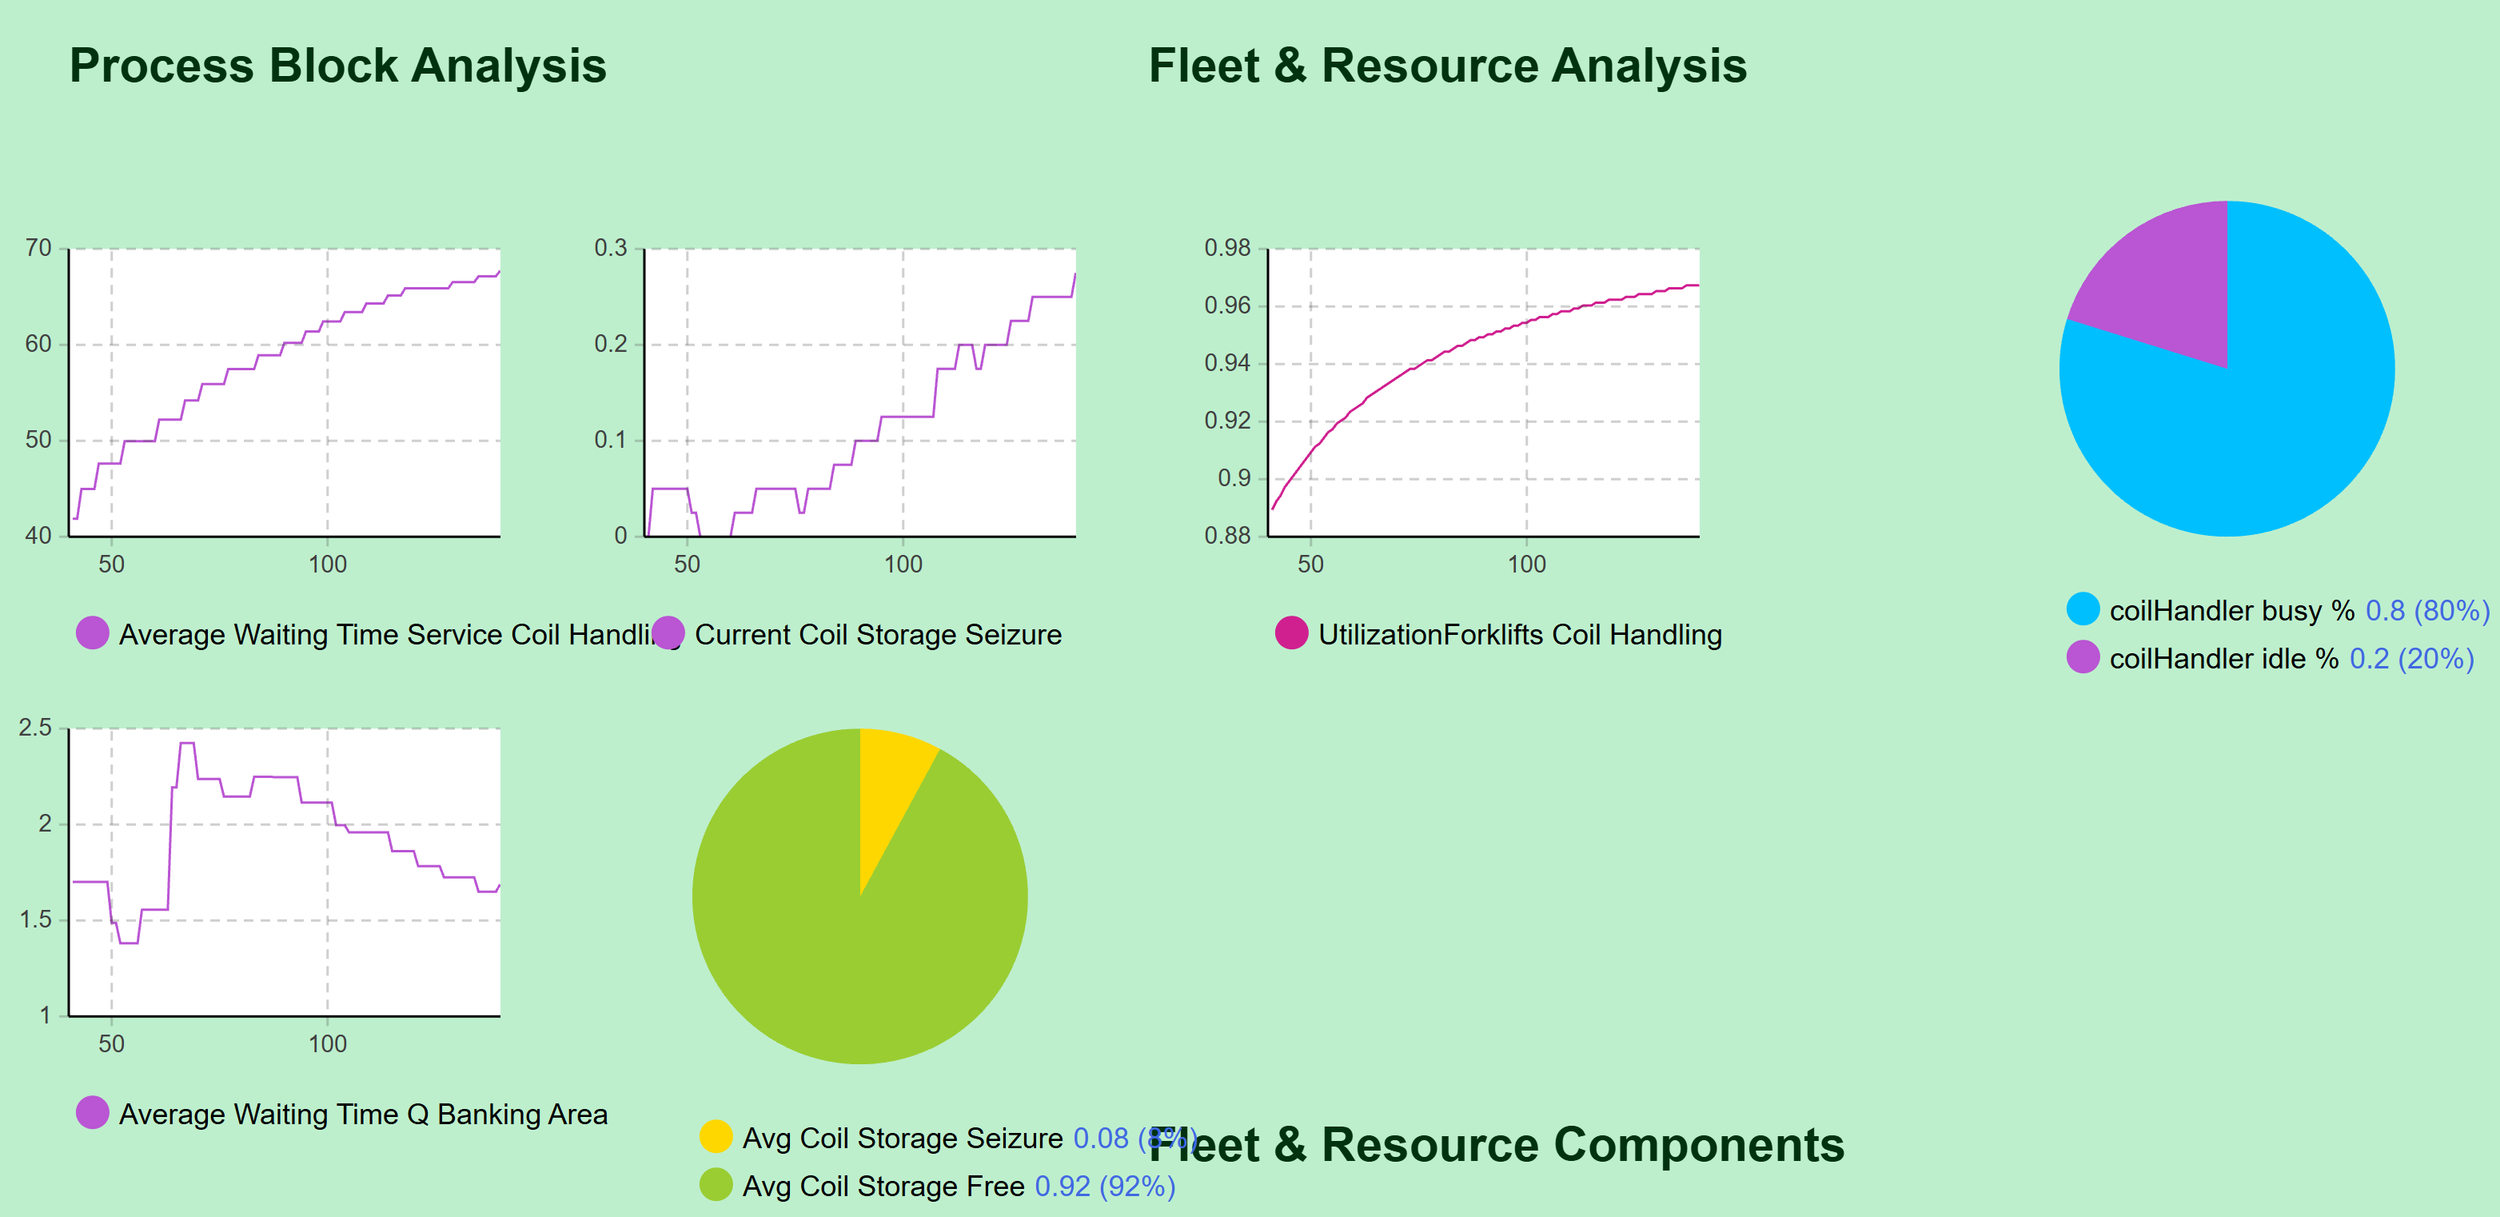
Below the logic you can see the different resource pools and fleets. I added data collection and data analysis in most blocks, resource pools and fleets. That way, we can have a better understanding of the utilization (fleet, stations, workers, …), waiting times / bottlenecks and energy usage. For now, I didn’t track detailed energy usage statistics yet – I am still working on it. Based on that data, I added various diagrams. It shows us interesting analysis during the simulation run. I am thinking about even adding weather events in the future which can affect the supply chain and, in the end, also the availability of – in this case – coil. Then I could not only see how to improve the manufacturing process itself but also could run “what-if”-analysis regarding external, environmental disasters.